Most vending operators collect data. Very few use it. The dashboard shows sales figures, transaction counts, and maybe a low-stock alert, but the numbers sit unread while restocking decisions still run on gut feel and fixed schedules. That gap between data collected and data acted on is where revenue leaks. This guide covers which data points actually matter, how to read what your machines are telling you, and how to turn raw telemetry into concrete decisions around product mix, restocking timing, pricing, and location performance.
What Data Does a Smart Vending Machine Actually Produce?
Before acting on data, you need to know what you are working with. A connected vending machine or AI micromarket generates several distinct data streams, each answering a different operational question.
- Transaction data. Every sale is logged by SKU, time of day, day of week, and payment method. This is your baseline and tells you what sold, when, and how.
- Inventory data. Real-time or near-real-time stock levels per slot. In camera-based systems like Neuroshop’s AI micromarkets, inventory updates with every pick-up, including put-backs. In older coil-based machines, inventory is estimated from sales counts minus restocked quantity.
- Temperature and equipment logs. Operational data flagging fridge malfunctions, door-open events, and power interruptions. Essential for food safety compliance and maintenance scheduling.
- Foot traffic and conversion data. Available in more advanced setups: how many people approached the machine versus how many completed a purchase. A low conversion rate points to a product mix or pricing issue, not a traffic issue.
- Payment method breakdown. Cash vs. card vs. mobile wallet. Useful for assessing cashless readiness and understanding the customer demographic at each location.
Knowing which question you are trying to answer determines which data stream to look at first.
The 4 Decisions Operators Should Be Making with Data
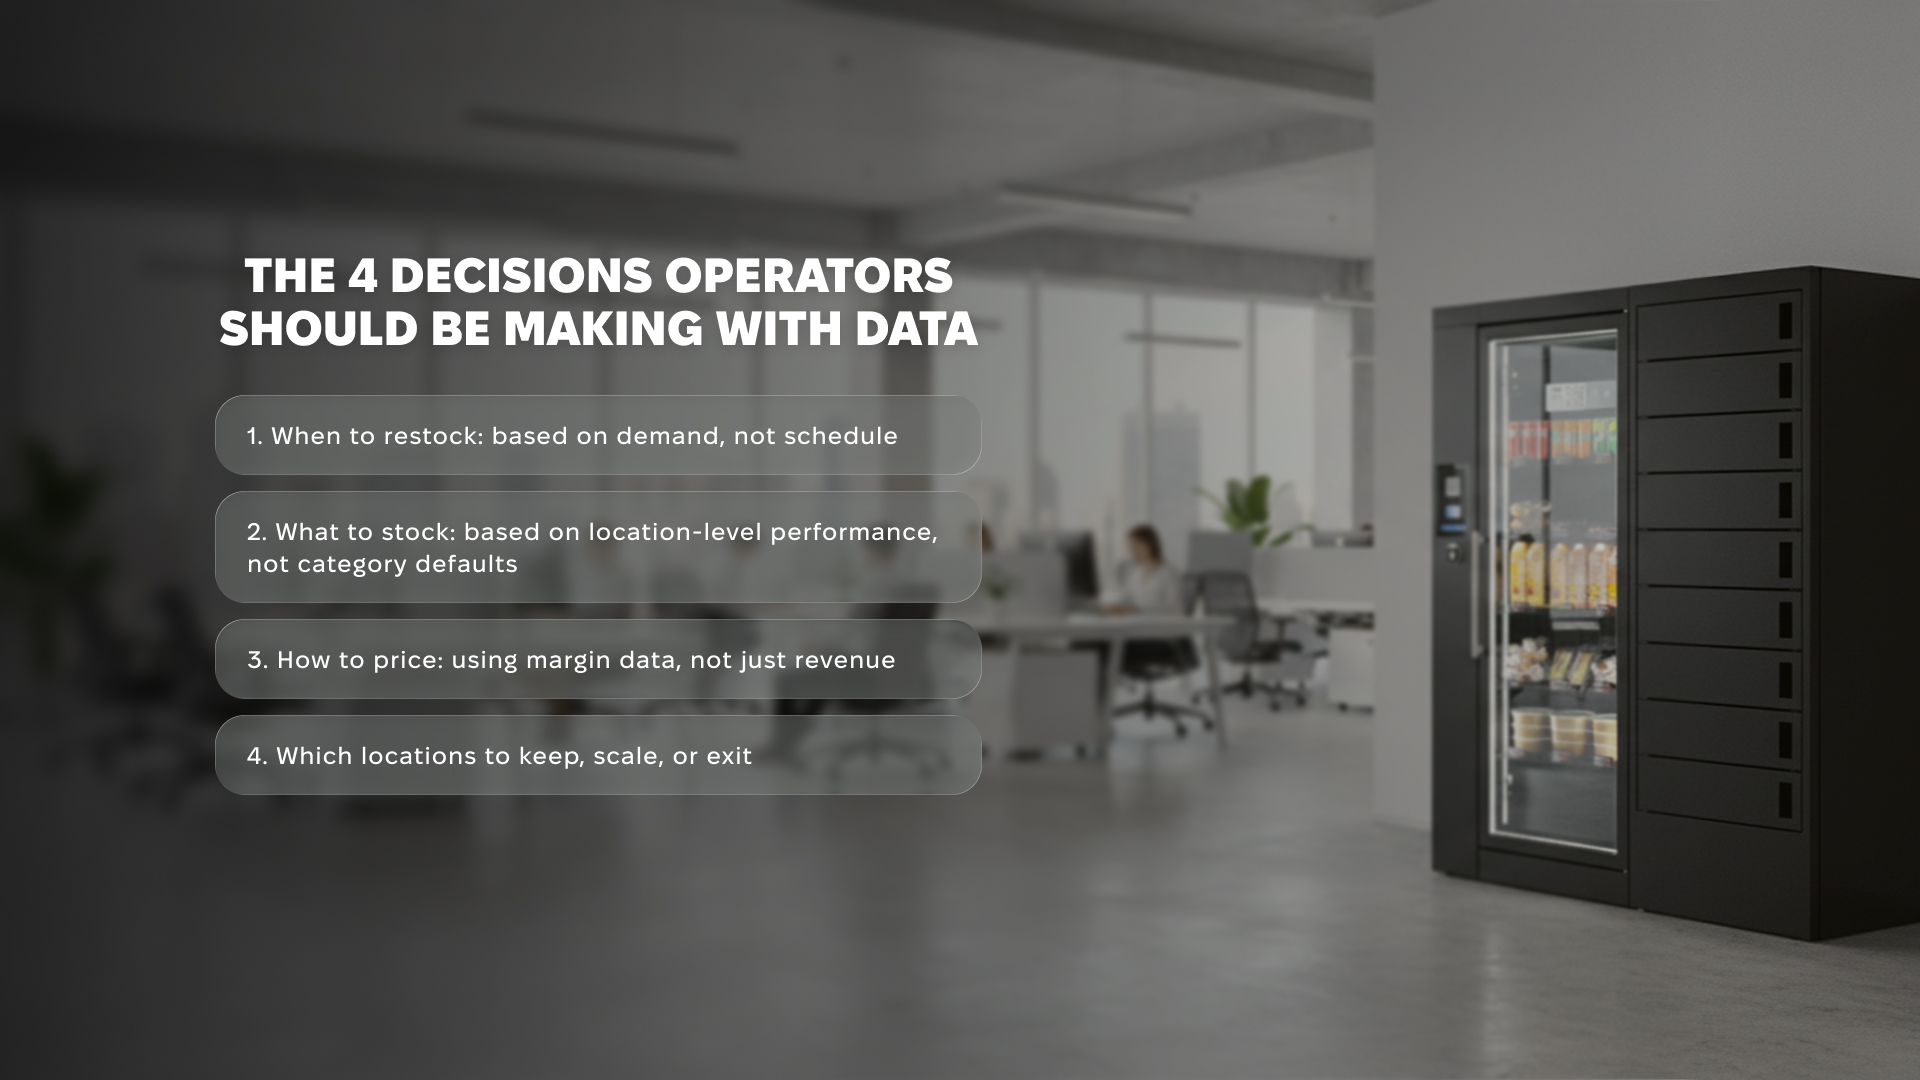
1. When to Restock: Based on Demand, Not Schedule
The most common restocking model is still calendar-based. Visit every Monday, or every three days, regardless of what is actually happening in the machine. This produces two predictable problems: stockouts on fast movers and wasted trips to machines that are still 80% full.
Data-driven restocking works differently. You set threshold alerts per SKU. When a product drops below a defined quantity, the system flags it, and you build the restocking visit around actual need across your route.
What to track:
- Stock level per SKU, updated daily or in real time for camera-based systems
- Velocity per SKU: how fast each product moves on average at each location
- Predicted days-to-stockout based on recent velocity
The output is a prioritised restocking list before you leave the warehouse, with each location ranked by urgency. Operators using Neuroshop’s telemetry platform can build this view directly from the dashboard, without manual calculation.
2. What to Stock: Based on Location-Level Performance, Not Category Defaults
A product that sells well in a gym does not sell the same way in a logistics warehouse. Operators who stock every machine with the same assortment leave money on the table at most of their locations.
SKU-level sales data by location shows which products are moving at each site and which slots are underperforming. That is the input for product mix decisions.
Three signals worth acting on:
- Slow movers. Any SKU with zero or near-zero sales over 14 days. That slot should be rotated.
- Stockout frequency. If a SKU keeps hitting zero before your next visit, it is undersupplied. Increase par level or restock more frequently.
- Substitution patterns. What do customers reach for when a preferred item is out? Substitution data reveals demand that stockouts have been masking.
See What Your Machines Are Actually Selling
Neuroshop's cloud dashboard gives you SKU-level sales data across every location, updated in real time. Know what to stock before you leave the warehouse.
3. How to Price: Using Margin Data, Not Just Revenue
Revenue per machine is a surface metric if you are not tracking it against cost. A slot generating €120 per month on a €0.40 cost-per-unit item at 30% margin is less valuable than a slot generating €80 on an item at 60% margin.
Margin tracking at the SKU level shows:
- Which products are your actual profit drivers, not just your top sellers by volume
- Where a price increase is likely to hold, typically low-elasticity items in captive locations
- Which products are underpriced relative to the location type
Location type matters for pricing. A vending machine in a corporate office park serves a different customer than one in a public transit hub. Data across your network makes location-specific pricing practical. A flat price list tends to undercharge in high-value locations and overcharge in price-sensitive ones.
4. Which Locations to Keep, Scale, or Exit
Not every placement is worth keeping. Site economics, meaning revenue minus restocking cost, machine depreciation, and location fees, vary significantly across a network. Without data, operators tend to hold underperforming locations too long and miss signals that a high-performing location could support a second machine or a format upgrade to a full AI micromarket.
Location performance analysis should include:
- Average monthly revenue per machine
- Revenue per visit: how much you earn for each restock trip
- Stockout rate: a high stockout rate often means demand is there but supply is not keeping up
- Foot traffic vs. conversion rate, where available
Locations with high traffic and low conversion are worth a product mix or pricing review first. Locations with genuinely low revenue and high visit cost are exit candidates. Data tells you which is which.
How to Build a Simple Data Review Routine
Knowing what data exists is one thing. Building a habit around reviewing it is where most operators stall. You do not need to spend hours in dashboards. A structured review on two cadences covers most decisions.
Weekly review, 15 minutes:
- Low-stock alerts. Which SKUs across which locations need attention before the next scheduled visit?
- Slow movers. Any SKU with no sales in the past 7 days at any location?
- Top performers by location. Is each location’s top-selling slot always fully stocked?
- Equipment flags. Any temperature or operational alerts needing follow-up?
Monthly review, 30 minutes:
- Revenue and margin by location: rank your locations by profitability
- Product mix: rotate slow movers, increase par on fast movers
- Pricing: are you leaving margin on the table at high-value locations?
- Route efficiency: are your restocking trips generating enough revenue per visit?
This rhythm works with any modern vending platform. The discipline is in reviewing consistently and making at least one decision each time you look at the numbers.
What Good Data Infrastructure Looks Like
Not all vending setups produce equally useful data. The quality and granularity depend on the hardware and software you are running.
- Camera-based inventory tracking produces real-time, SKU-level stock updates with every transaction. It handles multi-item grabs, put-backs, and product substitutions accurately. This is the most reliable input for restocking decisions, and the approach Neuroshop uses across its fridge vending machines and AI micromarket range.
- Weight-sensor or coil-count systems estimate inventory from sales logs. They are less accurate for similar-weight items and cannot detect put-backs. Workable for basic operations, but limited for deeper analytics.
- Integrated cloud dashboards consolidate data from multiple machines into a single view. Without consolidation, you are reviewing individual machine logs, which becomes unmanageable past a handful of locations.
- API integrations allow vending data to feed into inventory management, accounting, or ERP systems. Useful once a network grows past 10 to 15 locations.
Neuroshop’s platform combines camera-based inventory tracking, live telemetry, and a cloud dashboard built specifically for multi-location vending and micromarket operators. The full technology breakdown is in the AI technology guide for vending machines.
Common Data Mistakes Operators Make
Even with the right tools, there are patterns in how operators misuse or underuse their data.
Tracking revenue but not margin. Top-line revenue is easy to measure. Margin by SKU and by location is the number that shows whether you are building a profitable business or a busy one.
Acting on network averages. A product performing at average across your network might be a top performer at three locations and dead weight at seven others. Averages hide both the wins and the problems.
Ignoring stockout data. A stockout is a missed sale and a signal that your current supply level is not matching demand. Repeated stockouts at a location mean the par level or visit frequency needs adjusting.
Collecting data without acting on it. This is the most common failure. Data only creates value when it changes a decision. If your weekly review produces the same restocking list every time with no adjustments, you are storing data, not using it.
Final Take
Every transaction your machine logs is an input to a better restocking schedule, a sharper product mix, a more accurate price point, or a clearer picture of which locations are worth growing. The operators building profitable multi-location networks in 2026 are making faster, better-informed decisions because they have built a habit of acting on what their data shows. If you are running Neuroshop hardware, the data infrastructure is already in place. The next step is putting it to work.
FAQ
What vending machine sales data should I track first as a new operator? Start with transaction data by SKU and location, plus stock levels. These two streams directly inform your restocking schedule and product mix, which have the biggest impact on early-stage revenue and route efficiency.
How often should I review my vending machine sales data? A weekly review of stock alerts and slow movers takes about 15 minutes and covers most urgent decisions. A monthly review of margin, location profitability, and product mix takes around 30 minutes and informs your medium-term strategy.
Can I use sales data to decide when to add a second machine to a location? Yes. Consistent stockouts, high conversion rates, and strong revenue-per-visit figures at a location are clear signals that demand exceeds current capacity. Data makes the expansion case objective and easy to act on.
What is the difference between revenue data and margin data in vending? Revenue tells you how much money a product or location generates. Margin tells you how much of that revenue you keep after product cost. A high-revenue SKU at low margin may contribute less to profit than a mid-revenue SKU at strong margin.
Does vending machine data help with pricing decisions? Directly. Location-specific sales data shows which products hold stable demand regardless of price point, indicating room to increase prices without losing volume. Operators at captive locations such as offices, gyms, or warehouses typically have more pricing flexibility than those in high-footfall public spaces.